- Home
- Faculty Resources
- Helping Candidates Interpret Their Test Results
Helping Candidates Interpret Their Test Results
The candidate score report provides information about candidate strengths and weaknesses relative to the knowledge or skills described by the test competencies or objectives.
- For multiple-choice questions, performance information is provided for each content domain/subarea and competency/objective.
- Performance information is also provided for the constructed-response assignments.
Familiarize yourself with the sample score reports below. Also review the Understanding Your Test Results page. You can use that information to help candidates who are retaking a test understand how to use their score report in making their study plan.
Sample Score Reports: Elementary Education Subtest I
Elementary Education Subtest I contains multiple-choice questions, grouped into two domains. The range of possible scaled scores is 100 to 300. The passing score for each test can be found on the corresponding Test page.
Did not meet the passing score
There is a graphic of a sample score report with lettered red callouts that indicate pieces of information that will be referenced in the text that follows the graphic.
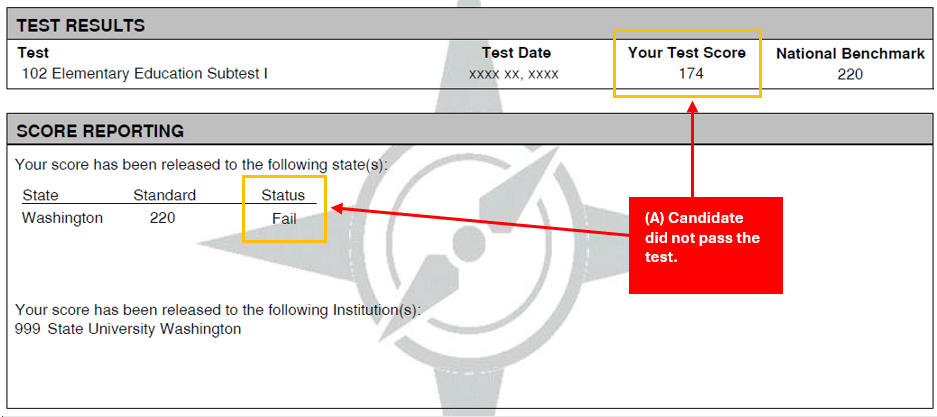
The title bar for the first section of the report says Test Results. The next line has four pieces of information. They are Test: 102 Elementary Education Subtest 1 Test Date: which is intentionally omitted. Your Test Score: 174. National Benchmark: 220.
The title bar for the second section of the report says Score Reporting. The sentence below the title reads Your score has been released to the following states. The next line has three pieces of information. They are State: Washington Standard: 220 Status: Fail. The next two lines read as follows: Your score has been released to the following Institutions: 999 State University Washington. Red callout A points to Your Test Score: 174 and Status: Fail. The callout says (A) Candidate did not pass the test.
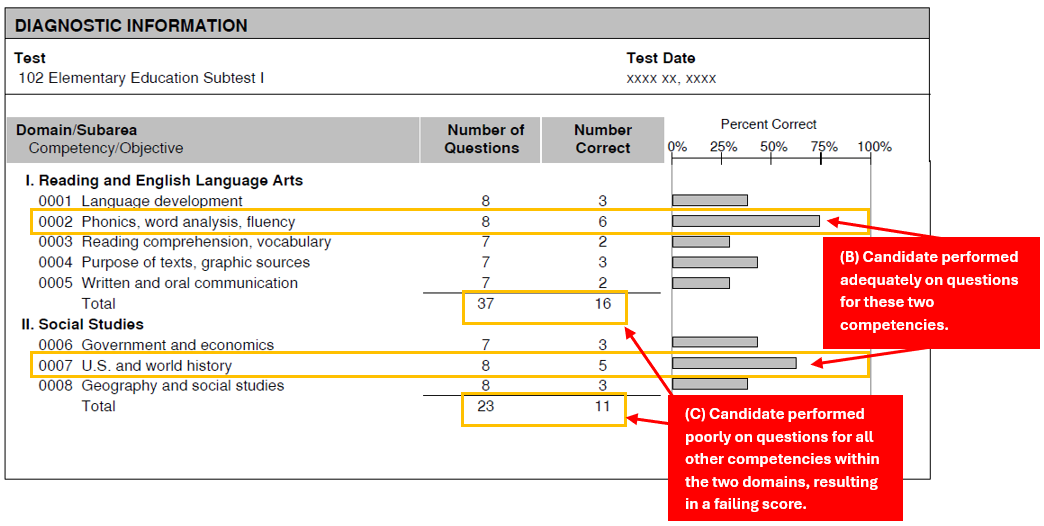
Another section of the score report is shown. The title bar for this section says Diagnostic Information. The next line has two pieces of information. They are Test: 102 Elementary Education Subtest 1 Test Date: which is intentionally omitted. Below this information is a four-column table. The heading of the first column is Domain/Subarea with a subheading below that says Competency/Objective. The heading of the second column is Number of Questions. The heading of the third column is Number Correct. The heading of the last column is Percent Correct, which shows percentages ranging from 0 percent to 100 percent in 25 percent increments. A bar graph depicts the percentage of questions answered correctly for each competency or objective.
I will now read the table.
1 Reading and English Language Arts, which includes the following competencies.
0001 Language Development. Number of Questions: 8. Number Correct: 3. Percentage Correct: roughly 38 percent.
0002 Phonics, word analysis, fluency. Number of Questions: 8. Number Correct: 6. Percentage Correct: 75 percent.
0003 Reading comprehension, vocabulary. Number of Questions: 7. Number Correct: 2. Percentage Correct: roughly 29 percent.
0004 Purpose of texts, graphics sources. Number of Questions: 7. Number Correct: 3. Percentage Correct: roughly 43 percent.
0005 Written and oral communication. Number of Questions: 7. Number Correct: 2. Percentage Correct: roughly 29 percent.
Total. Number of Questions: 37. Number Correct: 16. Bar graph of percent correct omitted.
2 Social Studies
0006 Government and economics. Number of Questions: 7. Number Correct: 3. Percentage Correct: roughly 29 percent.
0007 U.S. and world history. Number of Questions: 8. Number Correct: 5. Percentage Correct: roughly 63 percent.
0008 Geography and social studies. Number of Questions: 8. Number Correct: 3. Percentage Correct: roughly 38 percent.
Total. Number of Questions: 23. Number Correct: 11. Bar graph of percent correct omitted.
Red callout B points to Competencies 0002 and 0007 that indicate the candidate answered a majority of the items for these competencies correctly. The callout says (B) Candidate performed adequately on questions for these two competencies.
Red callout C points to the total number of questions and total number of correctly answered questions for both domains. The callout says (C) Candidate performed poorly on questions for all other competencies within the two domains, resulting in a failing score.
This sample score report shows that:
- the candidate did not pass (A), earning a scaled total test score of 174, and
- performance on questions for competencies 002 and 007 was relatively satisfactory (B), but generally weak performance on questions for the other competencies within the two domains contributed to a failing score (C).
Advising this candidate
Based on the information in the score report, you might advise the candidate to:
- concentrate most heavily on the areas of weakest performance;
- devote some additional studying areas where you performed marginally well, because improvement in any area within a domain will improve the total test score; and
- do a self-check of the Test-Taking Strategies section of the Study Guide: for example, the candidate might consider, During my last test attempt, did I use the remaining test time to review my answers for accuracy?
Met the passing score
The sample score report below shows that this candidate:
- met the passing score on Elementary Education Subtest I and
- did better in the domain Reading and English Language Arts than in Social Studies.
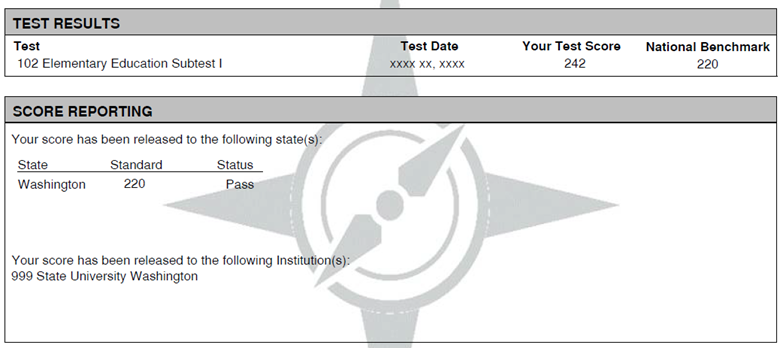
A graphic of a sample score report is shown. The title bar for the first section of the report says Test Results. The next line has four pieces of information. They are Test: 102 Elementary Education Subtest 1 Test Date: which is intentionally omitted. Your Test Score: 242. National Benchmark: 220.
The title bar for the second section of the report says Score Reporting. The sentence below the title reads Your score has been released to the following states. The next line has three pieces of information. They are State: Washington Standard: 220 Status: Pass. The next two lines read as follows: Your score has been released to the following Institutions: 999 State University Washington.
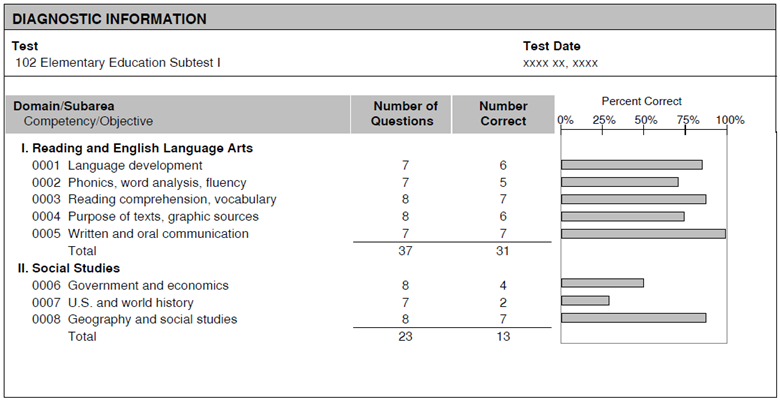
Another section of the score report is shown. The title bar for this section says Diagnostic Information. The next line has two pieces of information. They are Test: 102 Elementary Education Subtest 1 Test Date: which is intentionally omitted. Below this information is a four-column table. The heading of the first column is Domain/Subarea with a subheading below that says Competency/Objective. The heading of the second column is Number of Questions. The heading of the third column is Number Correct. The heading of the last column is Percent Correct, which shows percentages ranging from 0 percent to 100 percent in 25 percent increments. A bar graph depicts the percentage of questions answered correctly for each competency or objective.
I will now read the table.
1 Reading and English Language Arts, which includes the following competencies.
0001 Language Development. Number of Questions: 7. Number Correct: 6. Percentage Correct: roughly 86 percent.
0002 Phonics, word analysis, fluency. Number of Questions: 7. Number Correct: 5. Percentage Correct: roughly 71 percent.
0003 Reading comprehension, vocabulary. Number of Questions: 8. Number Correct: 7 Percentage Correct: roughly 88 percent.
0004 Purpose of texts, graphics sources. Number of Questions: 8 Number Correct: 6 Percentage Correct: 75 percent.
0005 Written and oral communication. Number of Questions: 7. Number Correct: 7 Percentage Correct: 100 percent.
Total. Number of Questions: 37. Number Correct: 31. Bar graph of percent correct omitted.
2 Social Studies
0006 Government and economics. Number of Questions: 8. Number Correct: 4. Percentage Correct: 50 percent.
0007 U.S. and world history. Number of Questions: 7. Number Correct: 2. Percentage Correct: roughly 29 percent.
0008 Geography and social studies. Number of Questions: 8. Number Correct: 7 . Percentage Correct: roughly 88 percent.
Total. Number of Questions: 23. Number Correct: 13. Bar graph of percent correct omitted.
NOTE: Each test, like other certification tests, samples a broad base of content applicable in a wide range of educational settings, grade levels, and teaching assignments covered by the certificate. The tests are not designed as diagnostic tests, which would include substantially more questions necessary for making diagnostic decisions about individual candidates.
Need More Time?
To continue your session, select Stay Signed In.
